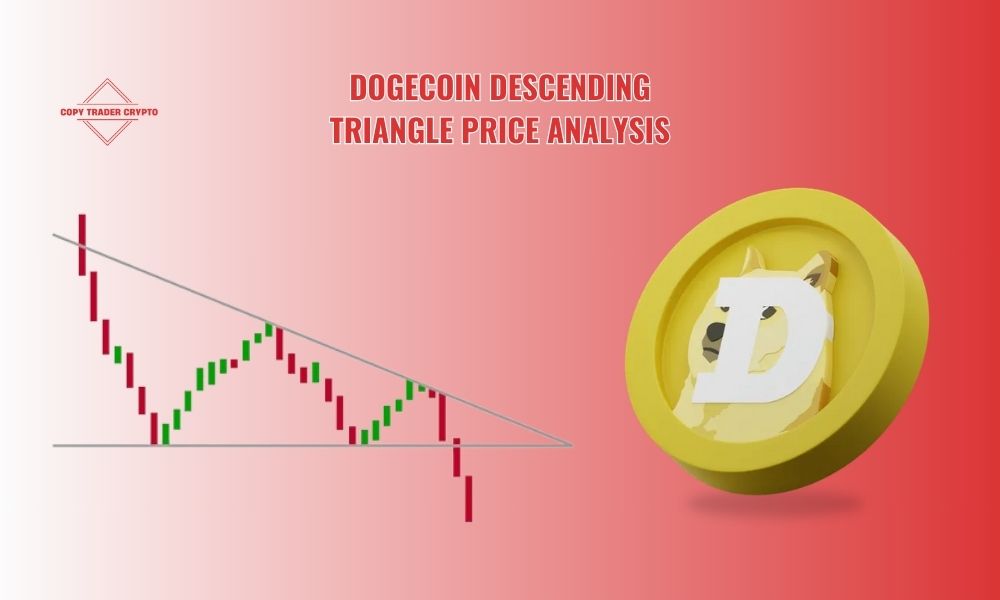
Dogecoin descending triangle price analysis reveals critical insights into its price movement as of April 15, 2025. The meme coin, known for its Shiba Inu mascot, is forming a descending triangle pattern, signaling potential volatility. This article explores the pattern’s implications, technical indicators, and key price levels to watch, offering investors a clear perspective on Dogecoin’s next move in a dynamic crypto market.

What is a descending triangle pattern?
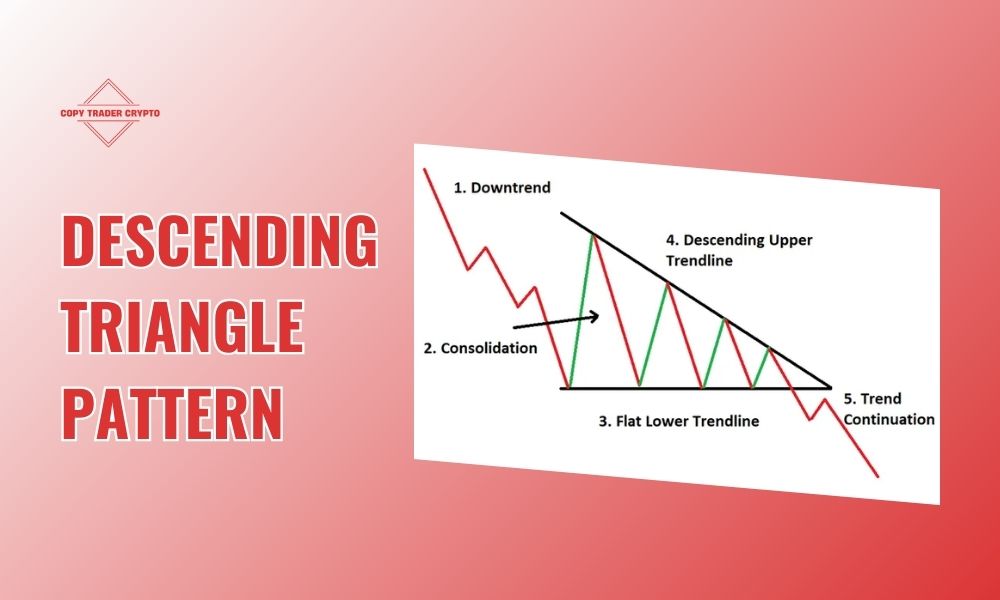
A descending triangle is a technical chart pattern signaling market consolidation, drawing traders’ attention to potential price shifts. It emerges as price action tightens, forming a clear structure on the chart. For Dogecoin, this pattern is generating buzz as investors anticipate a decisive move.
Characterized by a declining resistance line, the pattern shows prices creating lower highs, reflecting intensifying selling pressure with each fading rally. A horizontal support line remains steady, with prices repeatedly testing this level, showcasing resilient buyer defense. This dynamic creates the triangle’s narrowing range.
In Dogecoin descending triangle price analysis, a bearish outlook prevails if support breaks, suggesting a downtrend. Yet, a breakout above resistance could spark a bullish reversal, making Dogecoin’s next step pivotal for traders.

Dogecoin price overview: April 15, 2025
As of April 15, 2025, Dogecoin trades at approximately $0.1627, with a 24-hour trading volume of $1.63 billion. Over the past week, DOGE surged 24.3%, but it dipped 2.5% in the last 24 hours. The market sentiment remains neutral, with the Relative Strength Index (RSI) at 37.14, indicating neither overbought nor oversold conditions.
On shorter timeframes (1-hour and 4-hour charts), Dogecoin’s descending triangle is clear:
- Resistance line: Connects lower highs, currently at $0.17 – $0.18.
- Support line: Holds steady at $0.15 – $0.16, where prices have bounced multiple times.
This setup suggests a breakout or breakdown is imminent, making Dogecoin descending triangle price analysis crucial for traders.
Analyzing Dogecoin’s descending triangle
Bearish scenario
A break below the $0.15 support could trigger a sell-off. Potential price targets include:
- Fibonacci 0.618 level: Around $0.1388, the next support zone.
- Lower range: Continued selling may push prices to $0.12 or below.
Factors supporting a bearish outcome:
- Declining volume: Trading volume often decreases within the triangle, signaling weakening buyer momentum.
- Market fear: The Fear & Greed Index at 20.31 (Extreme Fear) reflects cautious sentiment.
- Technical indicators: Prices sit below the 50-day SMA ($0.18) and 200-day SMA ($0.26), reinforcing short-term bearish pressure.
Bullish scenario
A breakout above the $0.18 resistance could spark a rally. Potential targets include:
- Immediate resistance: $0.1972, aligning with the upper Bollinger Band.
- Higher target: A strong move could drive prices to $0.30 or beyond.
Factors supporting a bullish outcome:
- Whale accumulation: Recent data shows large wallets acquired 80 million DOGE in 24 hours, signaling confidence.
- Social media buzz: Positive posts on platforms like X, especially from figures like Elon Musk, often boost sentiment.
- Volume spike: A breakout with high volume would confirm bullish momentum.
Supporting technical indicators
RSI: At 37.14, it suggests room for upward movement if momentum shifts.
MACD: Currently bearish, but a bullish crossover could signal a trend change.
Bollinger Bands: Prices near the lower band ($0.1454) hint at a potential bounce if buying resumes.
Moving averages: Prices below the 50-day ($0.18) and 200-day ($0.26) SMAs indicate bearish bias, but a 50-day SMA crossing above the 200-day SMA would be a strong bullish signal.
Factors influencing Dogecoin’s price
Beyond the descending triangle price analysis, several factors shape Dogecoin’s trajectory:
Market correlation: Dogecoin closely follows Bitcoin, with a correlation of 0.886. If Bitcoin sustains above $83,000, it could propel DOGE upward, as broader market bullishness often amplifies altcoin gains, including this popular meme coin.
Whale activity: Recent on-chain data reveals whales purchased 80 million DOGE, a strong bullish signal. Such large-scale buying indicates confidence among major investors, potentially stabilizing prices and sparking upward momentum in Dogecoin’s volatile market environment.
Social sentiment: Posts on X and endorsements from high-profile influencers frequently trigger short-term price spikes. Dogecoin’s community-driven nature makes it sensitive to social media hype, which can rapidly shift sentiment and drive speculative trading activity.
Macro environment: Lower interest rates could channel more capital into cryptocurrencies, benefiting Dogecoin. A dovish monetary policy often encourages risk-on investments, boosting speculative assets like DOGE in a favorable economic climate for digital currencies.

Dogecoin price predictions
Based on Dogecoin descending triangle price analysis, here are potential scenarios:
| Timeframe | Predicted Price Range | Key Factors Influencing Prediction |
| Short-term (1-2 weeks) | $0.14 – $0.20 | Prices may oscillate between $0.15 and $0.18. A breakout above $0.18 could target $0.20, while a drop below $0.15 may hit $0.1388. |
| Mid-term (1-3 months) | $0.13 – $0.34 | A broader crypto recovery could push DOGE to $0.341 or even $0.50 in optimistic conditions. |
| Long-term (2025-2030) | $0.17 – $3.03 | Bullish forecasts suggest DOGE could reach $1 by late 2025 if community support and macro factors align. |
Tips for investors
When applying Dogecoin descending triangle price analysis, adopt these strategies to navigate the market effectively:
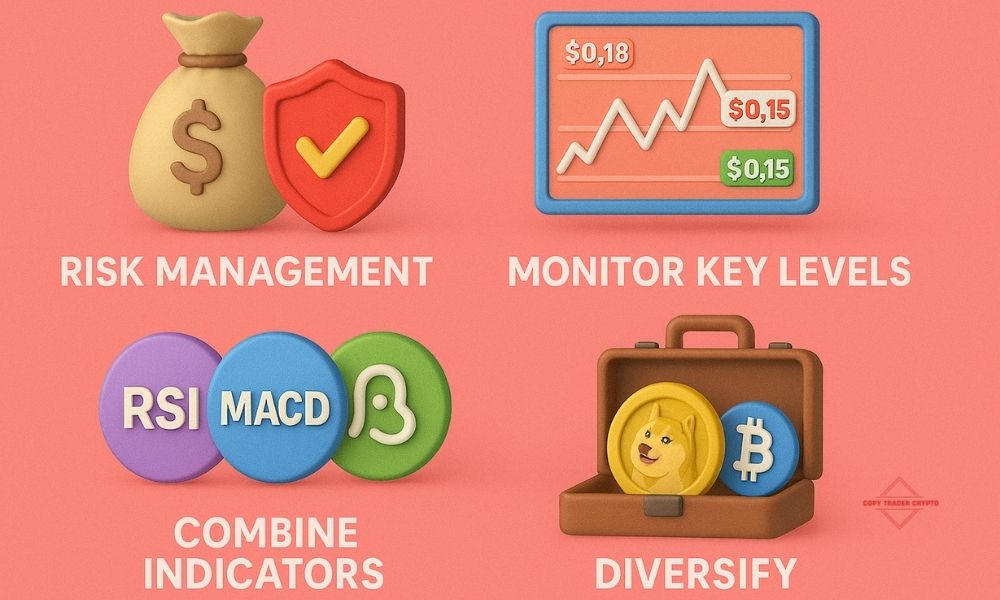
Risk management: Dogecoin’s high volatility demands caution. Only invest funds you can afford to lose to protect against sudden price swings, ensuring financial stability while trading this unpredictable meme coin in turbulent market conditions.
Monitor key levels: Focus on the $0.15 support and $0.18 resistance levels. These price points are critical for spotting potential breakout or breakdown signals, helping you time entries and exits with greater precision during Dogecoin’s consolidation phase.
Combine indicators: Enhance your analysis by integrating RSI, MACD, and Bollinger Bands. These tools validate trade signals, offering insights into momentum and volatility, which are essential for making informed decisions in Dogecoin’s dynamic price environment.
Diversify: Mitigate risk by balancing Dogecoin with other assets. Spreading investments across cryptocurrencies or traditional markets reduces exposure to DOGE’s volatility, creating a more resilient portfolio amid uncertain price movements in the crypto space.

Dogecoin descending triangle price analysis highlights a critical juncture for its price trajectory. With support anchored at $0.15 and resistance at $0.18, traders must prepare for potential volatility. The outcome, whether bearish or bullish, depends on trading volume and broader market sentiment. For real-time updates and trading signals on Dogecoin and other meme coins, follow Copy Trader Crypto. Stay ahead of market shifts, monitor whale activity, and capitalize on opportunities with timely insights from the bot’s engaged community.
